Disclaimer: Analysis is made by a novice in trading stocks. Thus, the information you read here is not an investment advise. Practice due diligence and always trade at your own risk.
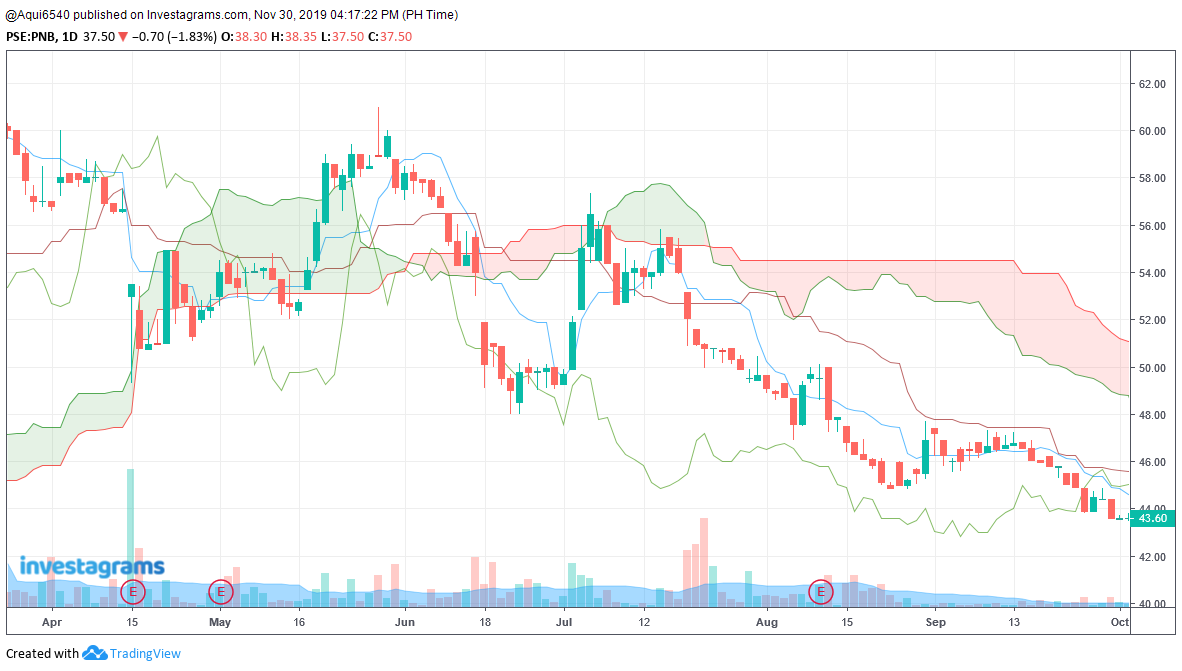 |
| Figure 1: Daily candles for PNB |
In daily candles, price action is below the cloud, Ks (Kijun-sen, Base line), and
Ts (Tenkan-sen, Conversion line). Likewise, Chikou span (Lagging span) is below the previous action. Kumo shows a bearish
future. Thus, there is no sign to enter a long position.
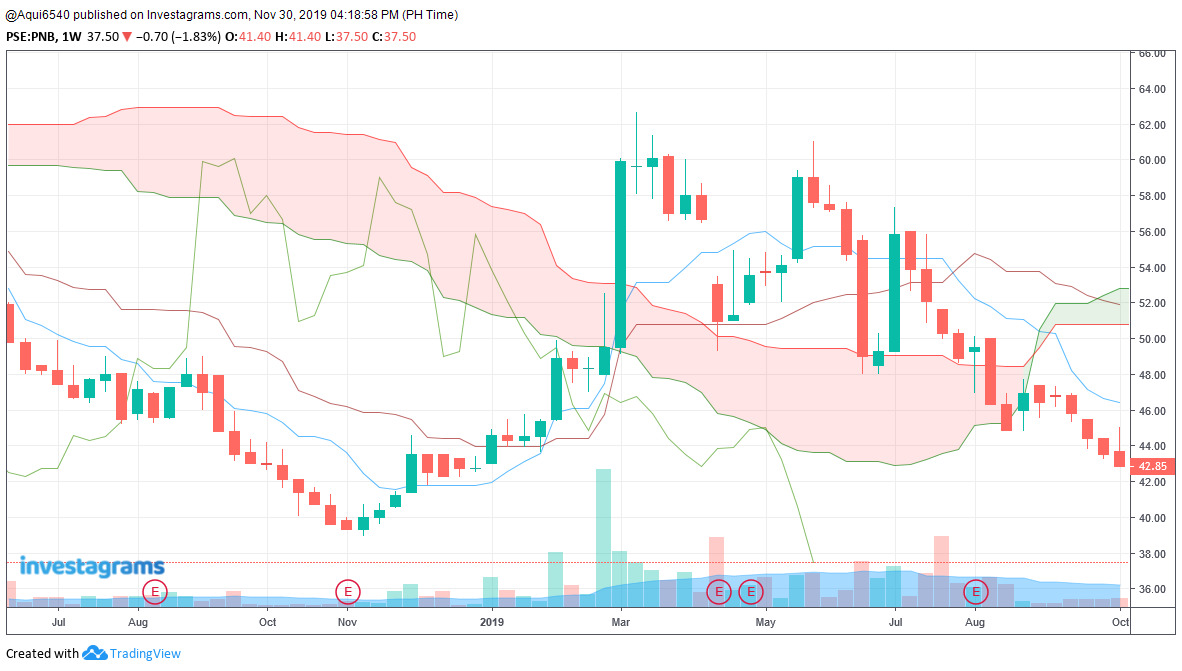 |
| Figure 2: Weekly candles for PNB |
In weekly candles, price action continues its downtrend
after a slight pullback following a kumo breakdown. Price action is below the
cloud, Ks, and Ts. Kumo twist happened recently from a bullish future to a
bearish future. Likewise, Chikou span is below the previous price action. Thus,
there is no reason yet to enter a long position supporting what daily candles
showed.
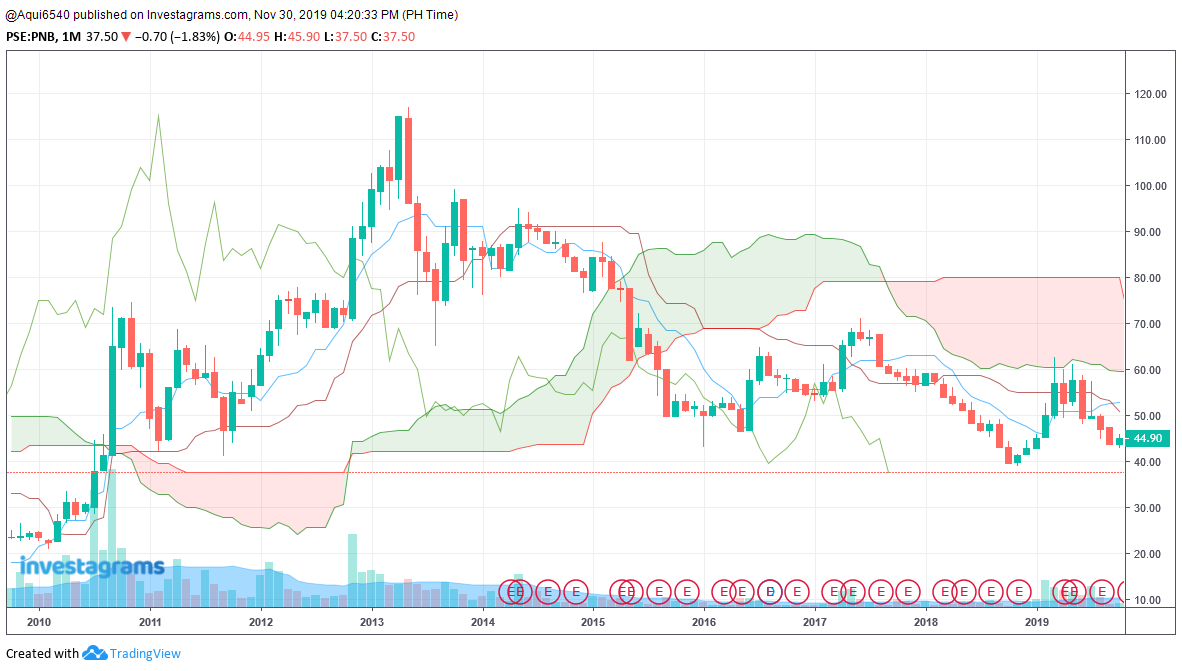 |
| Figure 3: Monthly candles for PNB |
In monthly candles, bearish TK cross just happened. Price
action is below the cloud, Ks, and Ts. Chikou span is also below the previous
price action. Bearish future is also present. Thus, reinforcing the need to
avoid entering a long position.
Conclusion: Different
time-frames show bearish. Thus, there is no sign to enter a long position.


No comments:
Post a Comment