 |
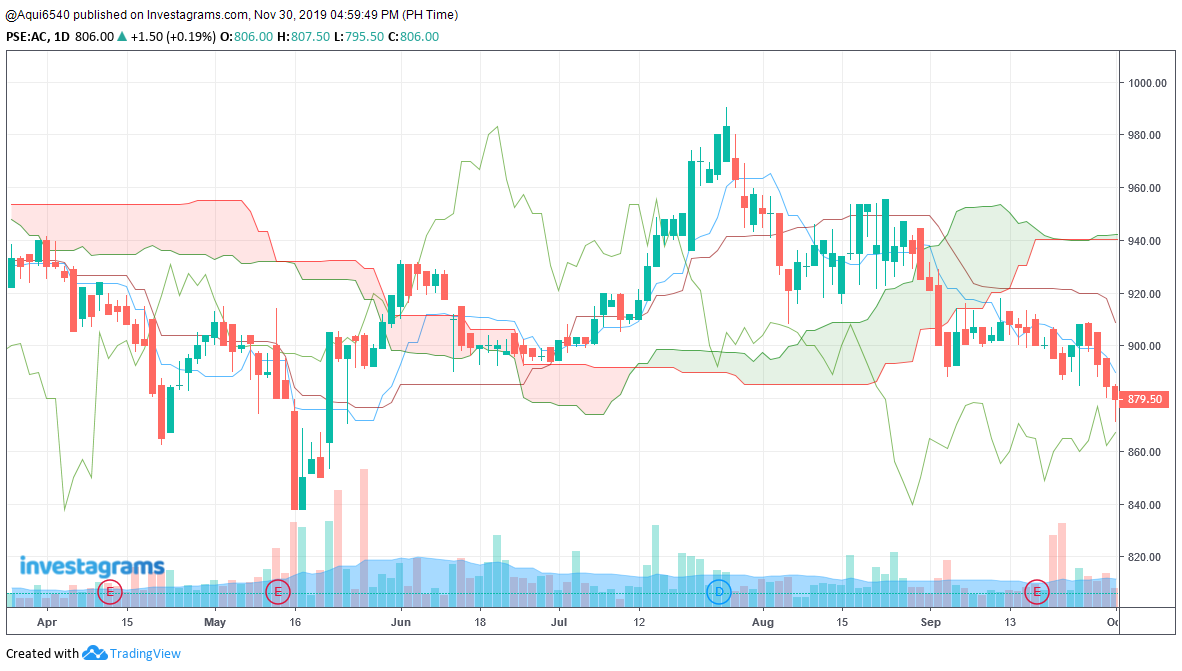
| Figure 1: Daily candles for AC |
In daily candles, price action is declining. Price action is
below the cloud, Ks (Kijun-sen, Base line), and Ts (Tenkan-sen, Conversion line). Chikou (Lagging) span is also below the previous price
action. Likewise, bearish future is evident. Thus, there is no signal for
entering long position.
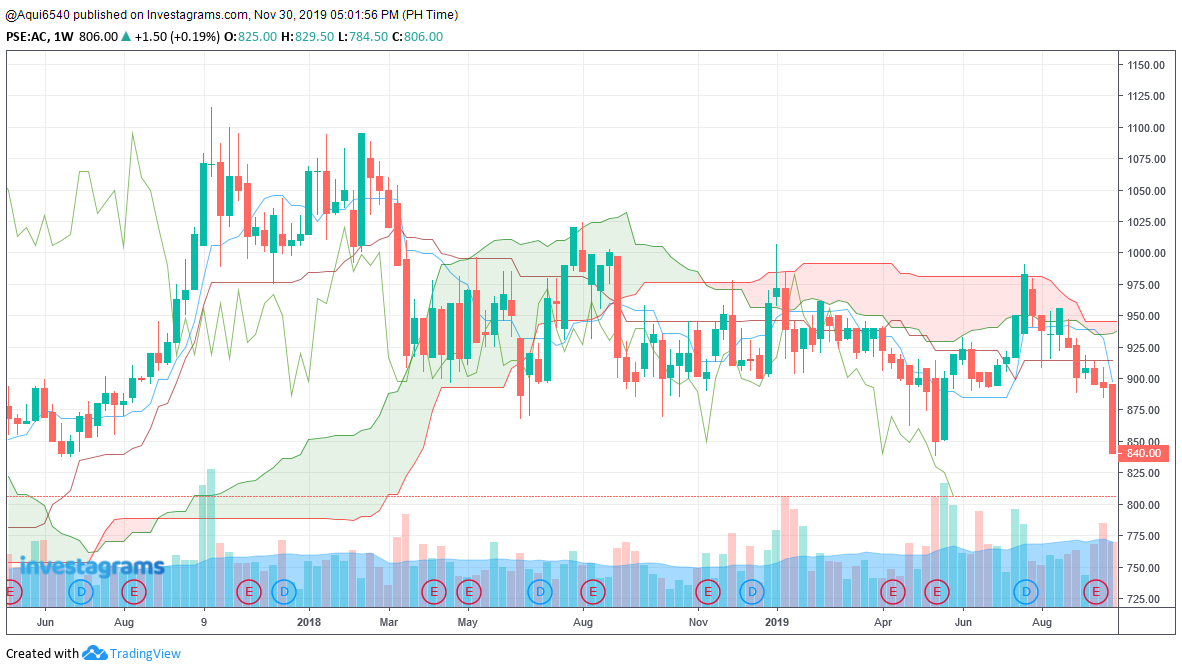 |
| Figure 2: Weekly candles for AC |
In weekly candles, bearish TK (Tenkan-sen - Kijun-sen) cross happened on the last
candle. Price action is below the cloud, Ks, and Ts. There is also a bearish
future. Thus, there is no signal for entering a long position.
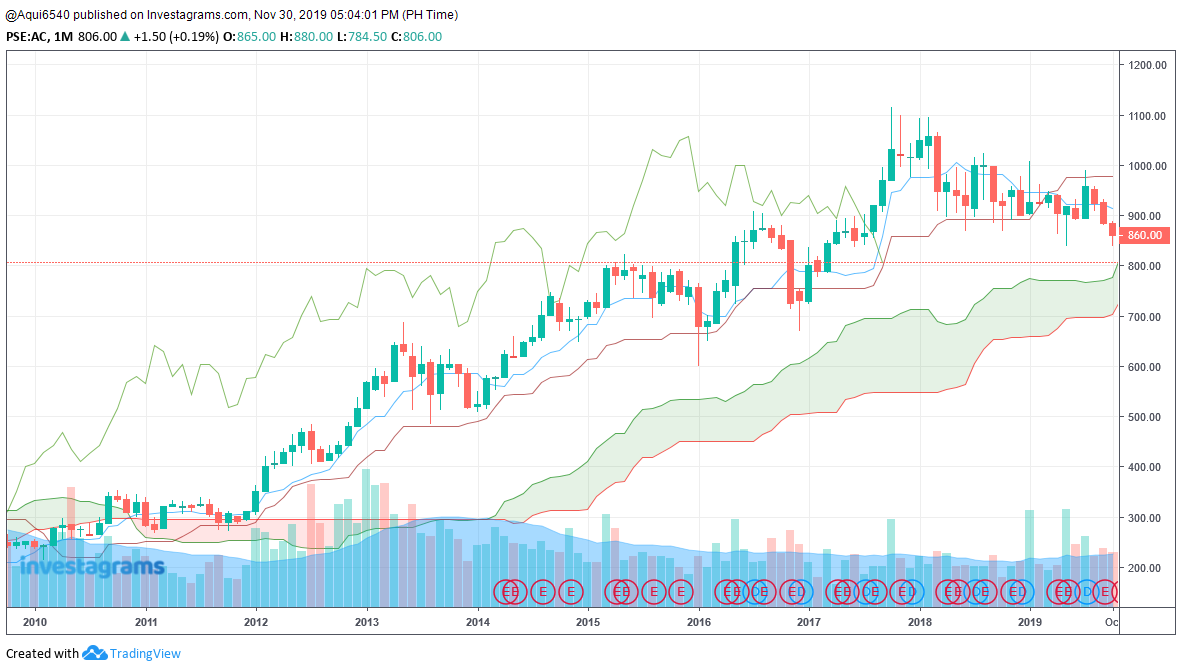 |
| Figure 3: Monthly candles for AC |
In monthly candles, the last three candles seemed to be from
a bounce from the Ks. Price action is above the cloud but below Ks and Ts. Ks
and Ts are almost flat. Chikou span is crossing down the previous price
actions. Despite the absence of an entry signal for long position, it is
important to watch over the kumo for a possible bounce and from there, a good
entry might be evident.
Conclusion: The TK
cross on August 2019 followed by the kumo breakdown on September 2019 prompts the exit
for a long position from the daily candles backed up by a kumo bounce on the
weekly candles. The monthly candle still has the cloud for a possible bullish
bounce, so it is important to watch over the price action above 800. Breakdown from 800 is a bad news. Wait for a
sign for long position entry.


No comments:
Post a Comment