Disclaimer: Analysis is made by a novice in trading stocks. Thus, the information you read here is not an investment advise. Practice due diligence and always trade at your own risk.
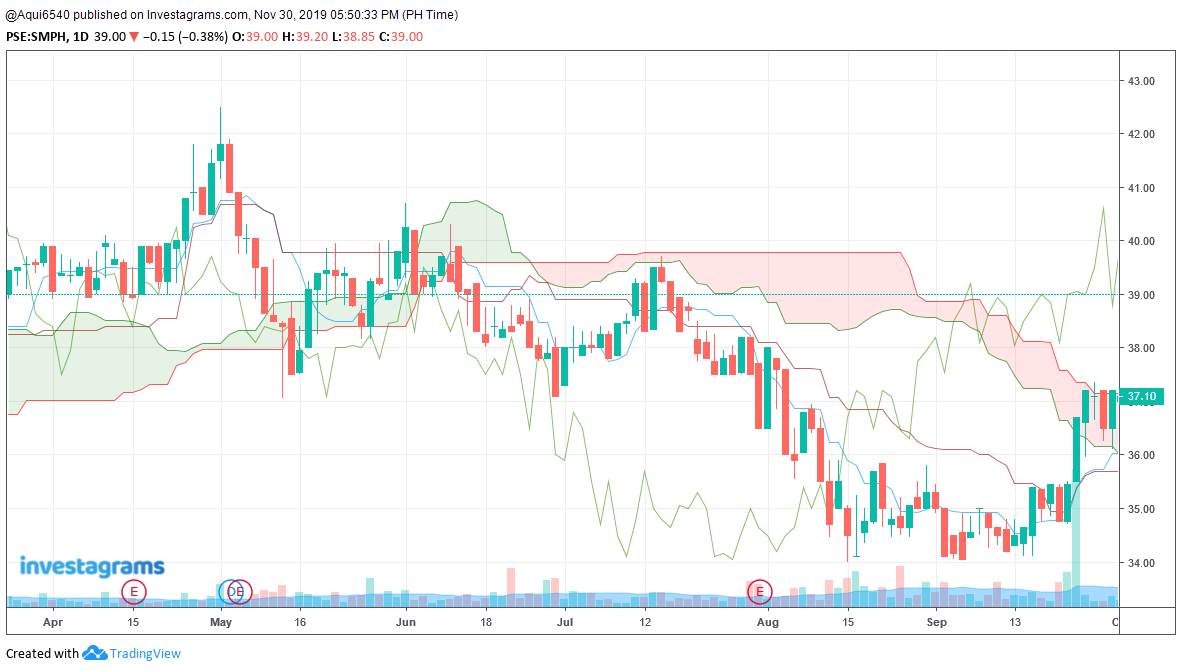 |
| Figure 1: Daily candles for SMPH |
In daily candles, the price action is above Ts (Tenkan-sen, Conversion line), Ks (Kijun-sen, Base line), and
inside the cloud near to the kumo breakout point (a little above, so did it break). Chikou (Lagging) span is also above the
previous candles. There are seven candles closing above Ks after it dips below
it. Likewise, the last two candles made the TK (Tenkan-sen - Kijun-sen) cross visible. However, the
future is bearish. Risk takers should have bought when the price action crosses
the Ts or Ks. For a bullish stance, there should be a kumo breakout (a decisive one), a kumo
twist towards a bullish future and a kumo breakout for Chikou span (which happens, since this is just a throwback).
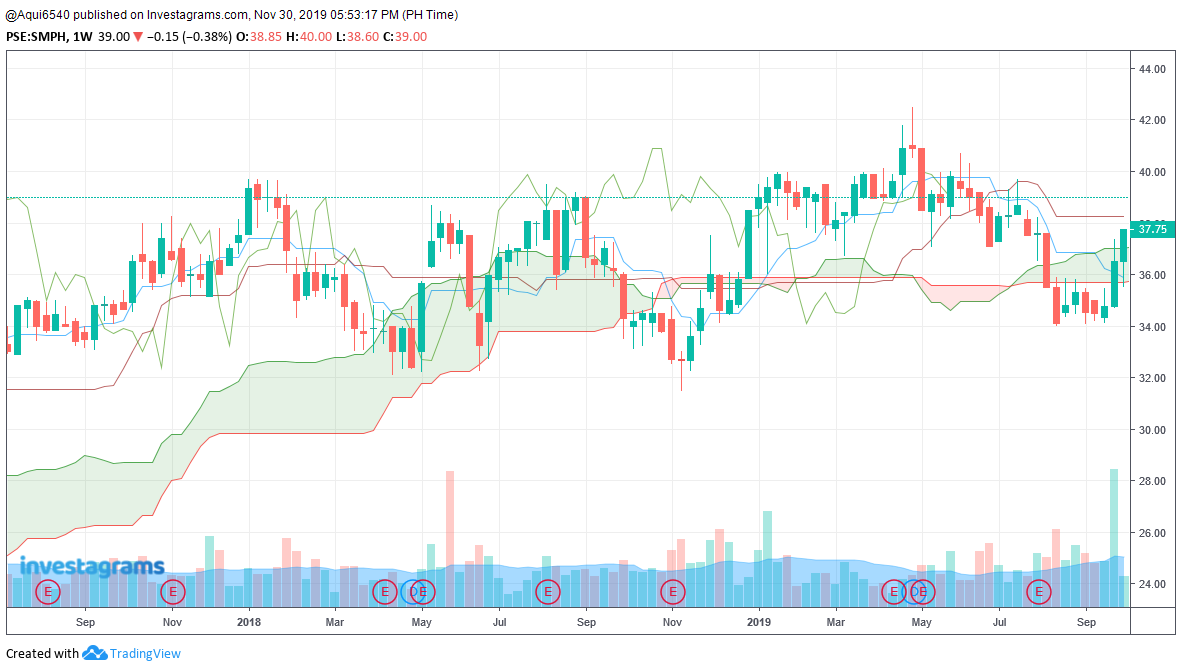 |
| Figure 2: Weekly candles for SMPH |
In weekly candles, the price action is within the cloud
attempting for a kumo breakout. The price action is below Ks but above Ts.
Chikou span is also below the previous price action but is above the cloud.
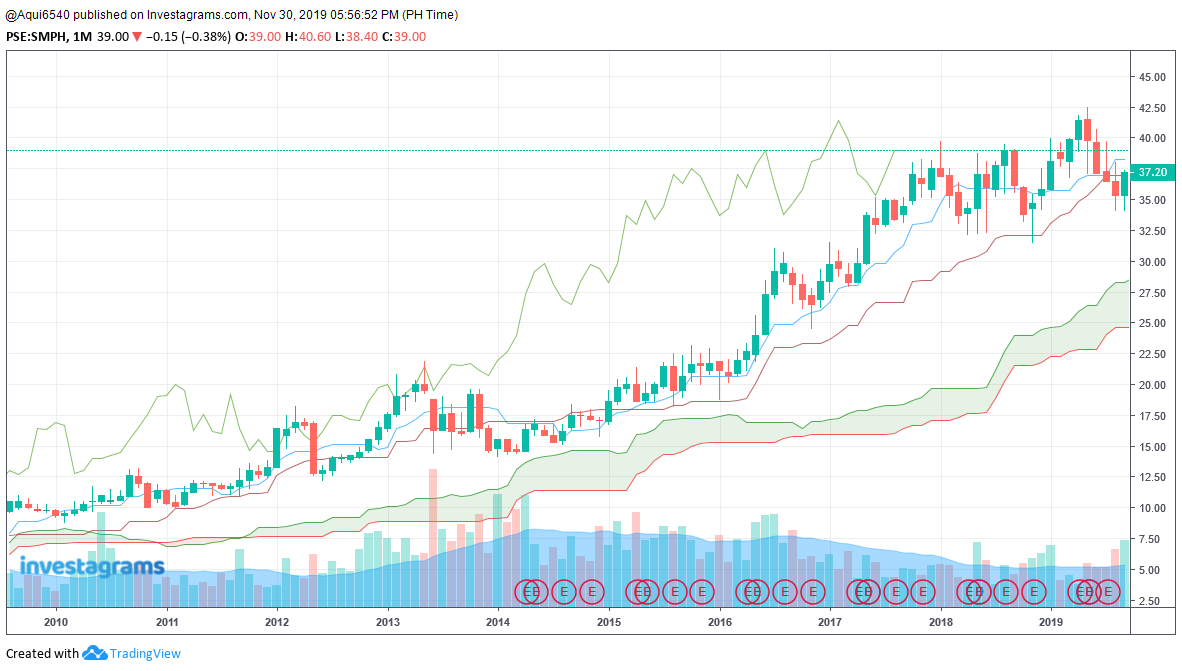 |
| Figure 3: Monthly candles for SMPH |
In monthly candle, the price action is above the cloud, Ks
but below Ts. Kumo future is bullish and chikou span is within the previous
price action.
Conclusion: Since
longer time-frame shows bullish, those who have positions below 30 may add up to
their positions. Short term investors may also enter a long position. But since
the movement upward is slow, it is not ideal to day traders. Make sure to
define a stop loss based on your loss tolerance.


