 |
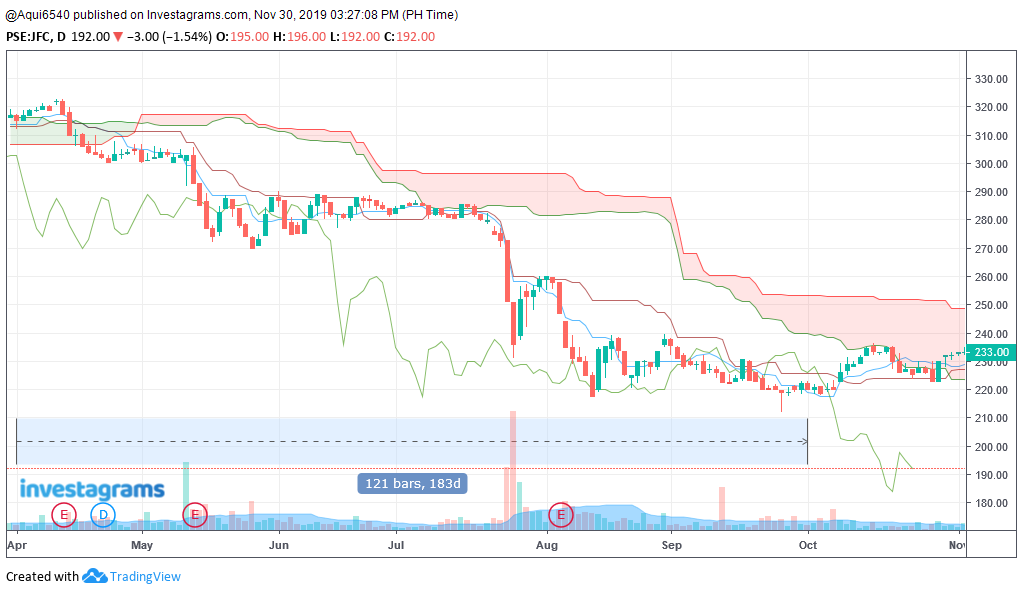
| Figure 1: Daily candles for JFC |
In daily candles, downtrend is weakening as price action
struggles between Ts (Tenkan-sen, Conversion line) and Ks (Kijun-sen, Base line). Bullish TK (Tenkan-sen - Kijun-sen, Conversion line - Base line) cross is not yet on sight and Chikou
span (Lagging span) is still below the previous price action. Furthermore, cloud shows a
bearish future. Thus, the only sign that is supporting a possible slight uptrend is the
crossing of price action and Ts.
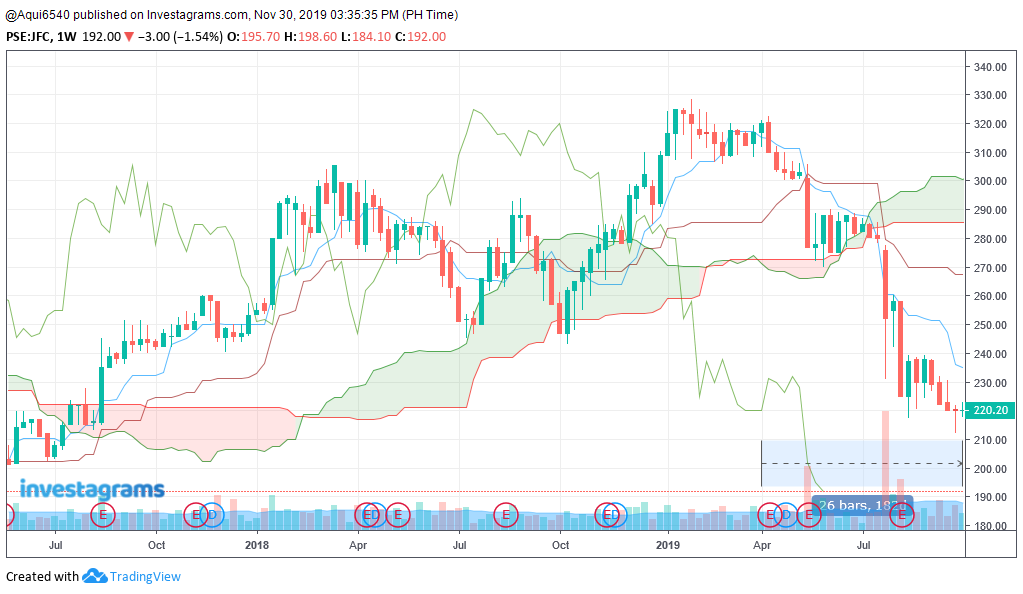 |
| Figure 2: Weekly candles for JFC |
Similar to daily candles, in weekly candles, there is a
weakening of downtrend. However, there is still no single sign of uptrend as
all the lines are above the price action except for the Chikou span which is
below the previous price action. Likewise, the cloud shows a bearish future.
Thus, it has to cross Ts first before getting ready to enter a long position.
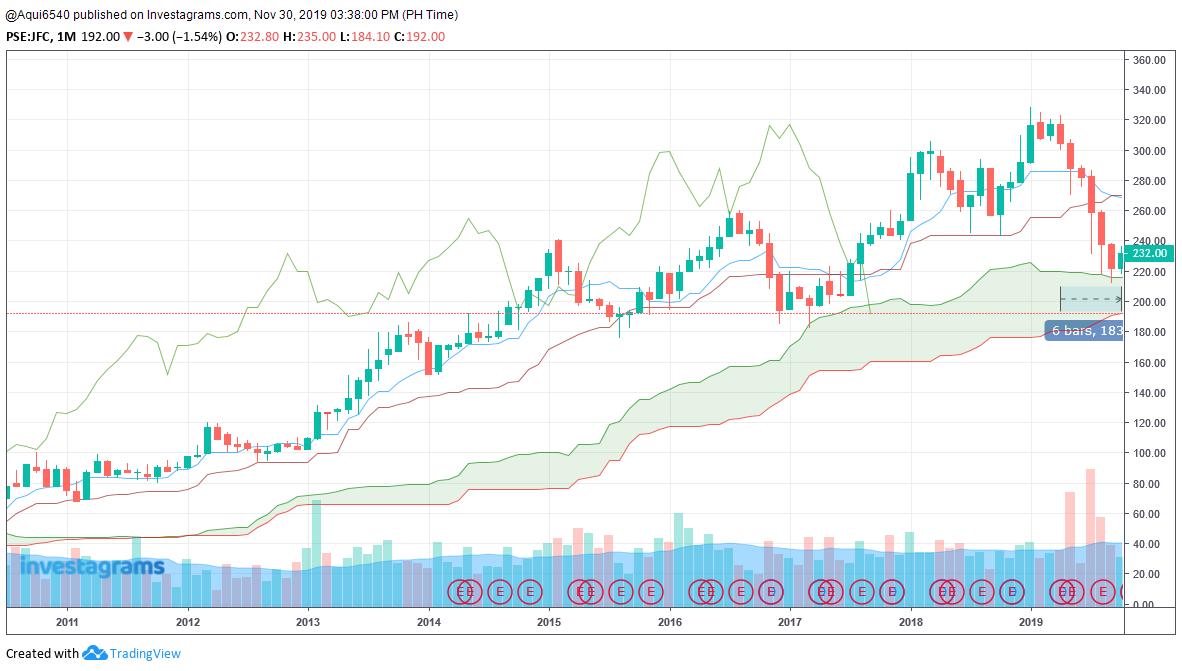 |
| Figure 3: Monthly candles for JFC |
In monthly candles, strong downtrend is evident. There is a
recent bearish TK cross and price action is below it. Likewise, Chikou span is
below the previous price action. However, the kumo shows a bullish future.
Relating these, especially with the recent bearish TK cross, which means a
strong warning signal to sell below the cloud, it is crucial to watch for a
kumo breakdown.
Conclusion: It was a
wise decision for those who exit their positions when daily candles show exit
signals or selling signals and that the price action was repeatedly rejected by
trend lines of the ichimoku. Risk takers may start accumulating but should be
mindful about kumo breakdown on monthly candles. Short term trades might be more profitable for the time being.


No comments:
Post a Comment