Disclaimer: Analysis is made by a novice in trading stocks. Thus, the
information you read here is not an investment advise. Practice due
diligence and always trade at your own risk.
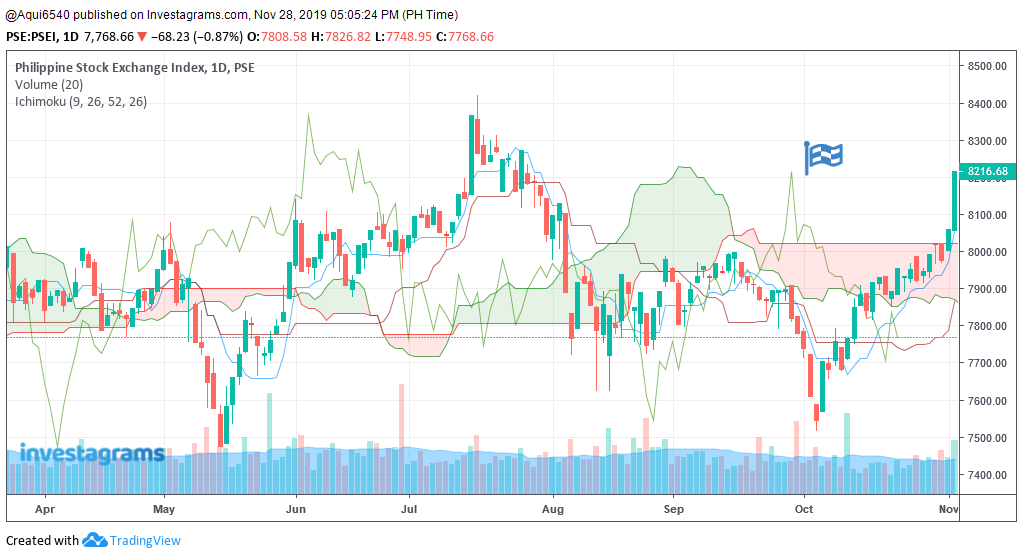 |
| Figure 1: Daily candles for PSEI |
Daily candle shows sideways price action. However, Ichimoku shows bearish bias. There is a bearish TK cross and the price is below them. Chikou span is also below the previous price action. Cloud shows a bearish future. Thus, wait for signals for long position. Last price based on chart coincides to the selling price signaled by the kumo breakdown last August 2019.
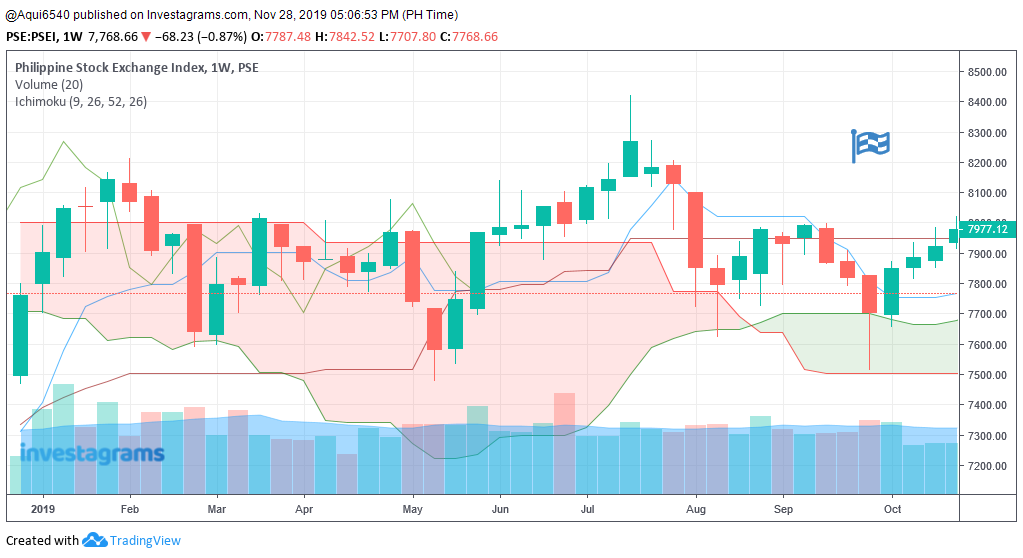 |
| Figure 2: Weekly candles for PSEI |
Weekly candle shows sideways price action as well but has
mixed bias. Bearish TK crossover happened last week and price action is already
below TK. Chikou span is also below the previous price action and is inside the
cloud. There is a bullish future based on kumo. Thus, as long as the price
action is above the cloud, there is no need to sell aggressively although,
lightening the position at strength is recommended since a TK cross above the
cloud is a strong signal to sell below the cloud.
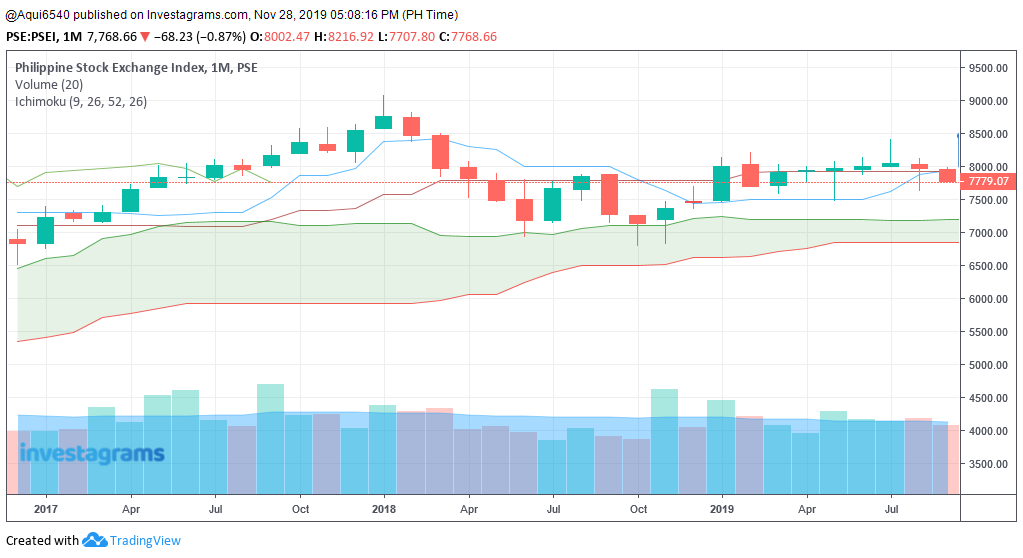 |
| Figure 3: Monthly candles for PSEI |
Monthly candle shows that the uptrend is slowing down.
Bullish TK cross is present but price action is below TK. Likewise, chikou span
is below the previous price action. Cloud shows bullish future. Thus,
recommendation to lighten the position is reinforced due to weakening upward
trend. A bounce from above 7000 or right above the cloud with high volume is highly
needed for bullish market.
Conclusion: Lighten
the position on strength and start buying when upward price action is
reinforced by higher volume.
Update: [November 28, 2019] The index had short term rally on October and went down again. On daily, the price seats right above the bottom part of the cloud.


No comments:
Post a Comment